What is TIA?
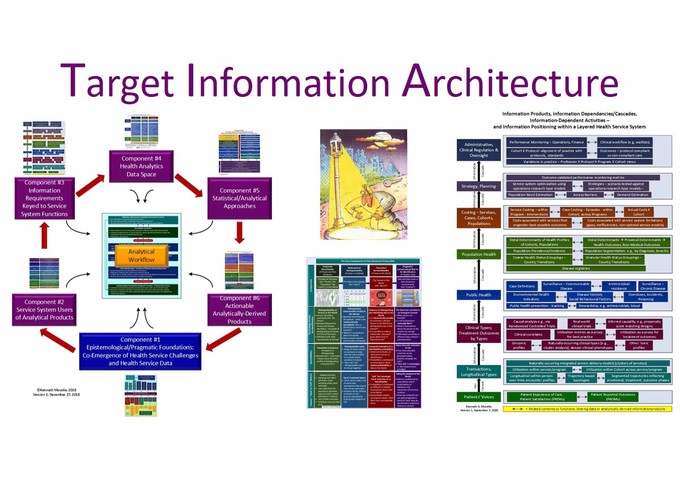
A TIA is an graphical rendering of answers to a series of linked questions relating to analytic products from data to support the functions performed by persons, providers or programs within a health system.
The TIA for health service delivery and health service system operations, depicted in this presentation, speaks to the following questions/issues:
- Slide #11 - Component #1 – Epistemological foundations – where do health issues/problems become manifest, and what types/classes of information do we require to respond to those issues?
- Slide #13, #16 – Component #2 – what functions - layered organization of the service system and key information-dependent functions performed within layers.
- Slide #17, #18 – Component #3 – what information products? How are these products keyed to layers within the service system and functions that can be optimized using those products.
- Slide #19, #20 – Component #4 – what data? To generate the products in Slide #17, where must we go to find the data? How are those contents architected? What contents are foundational?
- Slide #21 – Component #5 – What statistical/Analytical approaches – what analytical capabilities are required to translate the data from Slide #19 into the products in Slide #17 on behalf of the layers/functions depicted in slide #13.
- Slide #22, 23 – Component #6 – what actionable, analytical-derived products? What are the information/evidence “deliverables” – what do the programs/providers in Slide #13 “see”? This slide is closely related to Slide #17.
Slides #13, 17, 19, and 22 are duplicated in the presentation, with highlighting to show where data from community services, from health authorities, and from the Ministry of Health figure in these architectural renderings. This highlighting is a bit complicated because data sources, data products and data uses from these three sources interact with one another and are often not cleanly demarcated.
What else is in the presentation?
- Slides #5 – 8 – some material related to the question: “why construct a TIA”?
- Slides #24 – 26 – putting the model to work –
a.Slides #19 (what data) and #13 (what products) are used to supply “containers” for displaying the data requirements and intended deliverables associated with a program of research in Island Health that leverages off of the Ministry of Health Minimum Requirements Data for Mental Health & Substance Use – and off of transactional encounter data from the 1700+ program entities that collectively constitute the clinical “business end” of the health authority.
b.The contents depicted in Slides #25, 26 are intended to illustrate the use of the TIA to catalogue information-relevant contents associated with a complex analytical program of research.
- Slides #28-30 – some critical limitations of the TIA in the powerpoint; some principles and other contents abstracted from the TIA model.
- Slides #31-33 – lead-in to the second presentation – a brief glimpse into a data disclosure privacy risk model that provides the foundation for a set of standard operating procedures intended to take the types of high-dimensional datasets depicted in Slide #19, subject them to the types of analytical approaches depicted in Slide #21, in order to generate the products depicted in Slide #17 and #22.
Why construct a Target Information Architecture?
See Slide #5.
Briefly:
- To manage the complexity of generating useful products from health data.
- To supply a targeting mechanism for the processes that are involved in setting analytics priorities and structuring the work of programs or divisions that are tasked with working with data to produce products that are intended to perform a function.
- To offset a potential for services/programs/systems to work from what data are reasonably readily available, using “in-house” analytical tools and capabilities, to respond to immediate pressures for delivering products.
Possible next steps
- Create a “wire-frame” version of the architecture that strips out much of the detailed material that relates primarily to services/processes within a health authority (which was the original focus of the TIA in the powerpoint).
- Repopulate and possibly re-architect the model with contents that are more fully informed by data that exist within the community/primary care space, reflecting the potential uses of the products derived from those data.
- Repopulate and possibly re-architect the model to reflect divisions and planning/executive functions performed within the Ministry of Health.
- Repopulate and possibly re-architect the model to reflect data sources across government and the uses of products derived from those sources (e.g,. related to Digital Platforms and Data Division).